I built a model that scores how much a chart lies, and it won first place

Carson Rodrigues / November 21, 2026
6 min read • ––– views
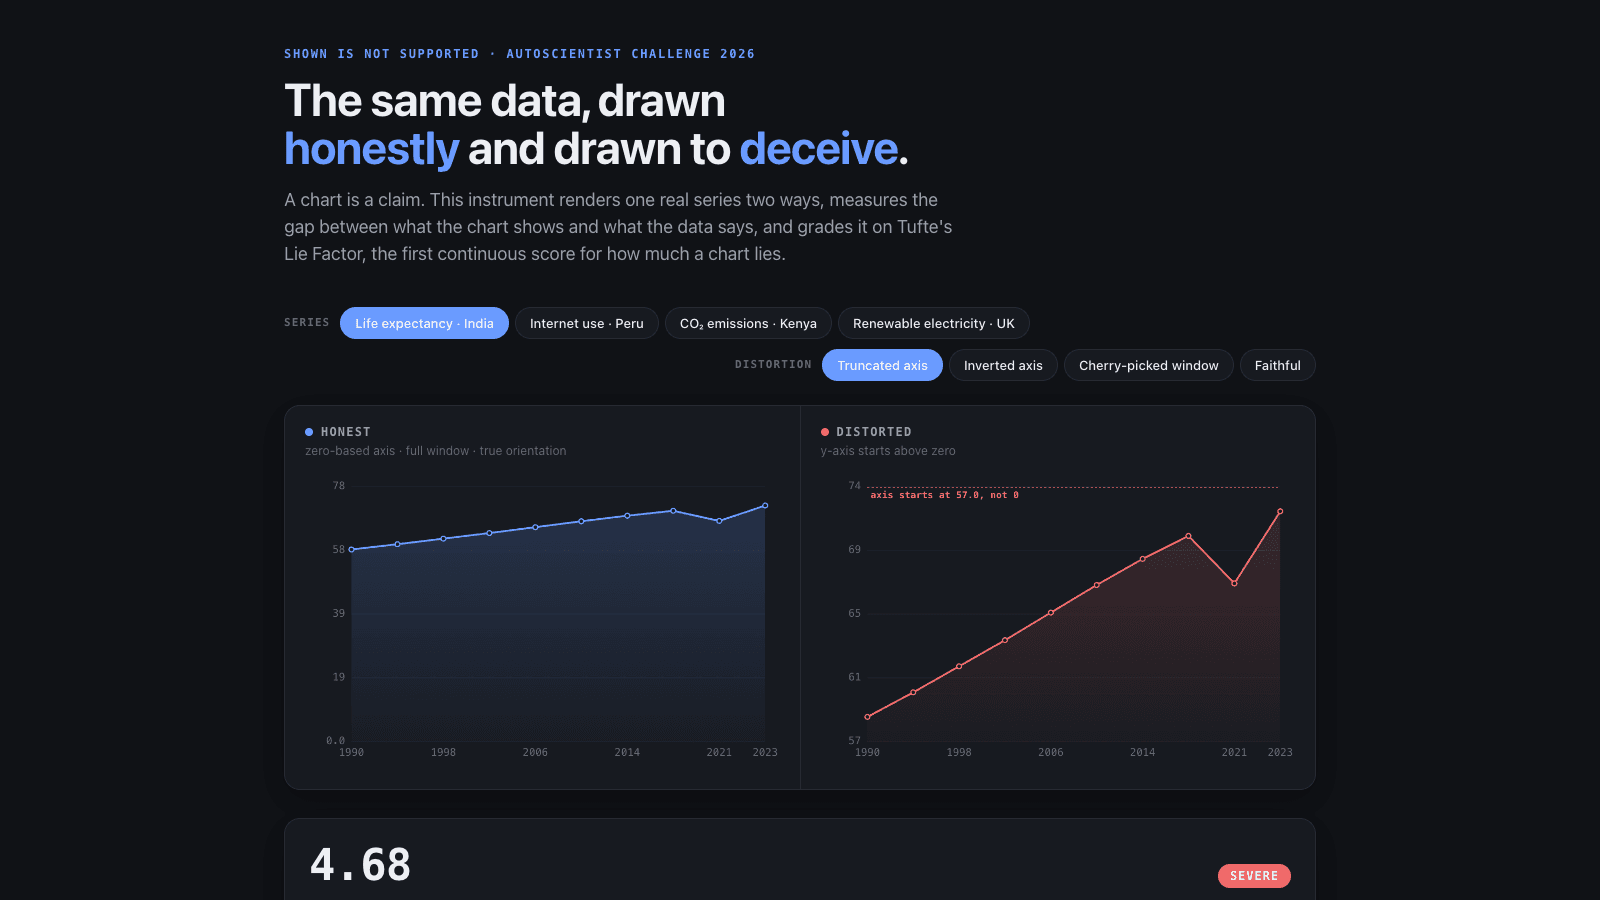
A chart can mislead you without a single wrong number on it, and most of us never check.
Take a line that climbs steeply. Look closer and the bottom of the axis starts at 57, not zero. Every label is true. The picture still tells you something the data doesn't.
| Hackathon | AutoScientist Challenge, Part 2 |
| Organiser | Adaption Labs |
| When | 6 July to 10 August 2026, winners announced 18 August |
| Field | Not published by the organisers |
| Result and rank | 1st place, Data & Visualization (each of the seven categories named one first place and one runner-up) |
| Built in | The five-week challenge window |
| Team | Solo |
| Money spent | Not tracked in rupees or dollars. Base training was covered by a platform voucher. Only the extra synthetic rows used credits, at about 1 credit per 100 rows |
| Code | github.com/rodriguescarson/adaption-autoscientist-api |
The challenge
Adaption Labs ran the AutoScientist Challenge, Part 2, from 6 July to 10 August 2026. Adaption makes a tool that fine-tunes an AI model on your data, meaning it teaches a model a new skill using examples you give it. Part 2 had seven categories: Science, Agriculture, Personal Finance, Data & Visualization, Market Analysis and News, HR, and Math and Code. Each category named a first place and a runner-up.
Judges looked at how well you used the platform and what you made with it. My read, after the fact, is that the thing that counted most was data nobody else had.
What I built
I called it PolyChart. Give it a chart and the numbers behind it, and it tells you how much the chart lies.
The score comes from an old idea by the statistician Edward Tufte, the Lie Factor. It compares how big an effect looks in the picture with how big it is in the data. I made it a continuous number, not a yes or no. A mild squeeze scores low. A truncated axis that turns a small rise into a cliff scores high, and the sign tells you which way it misleads.
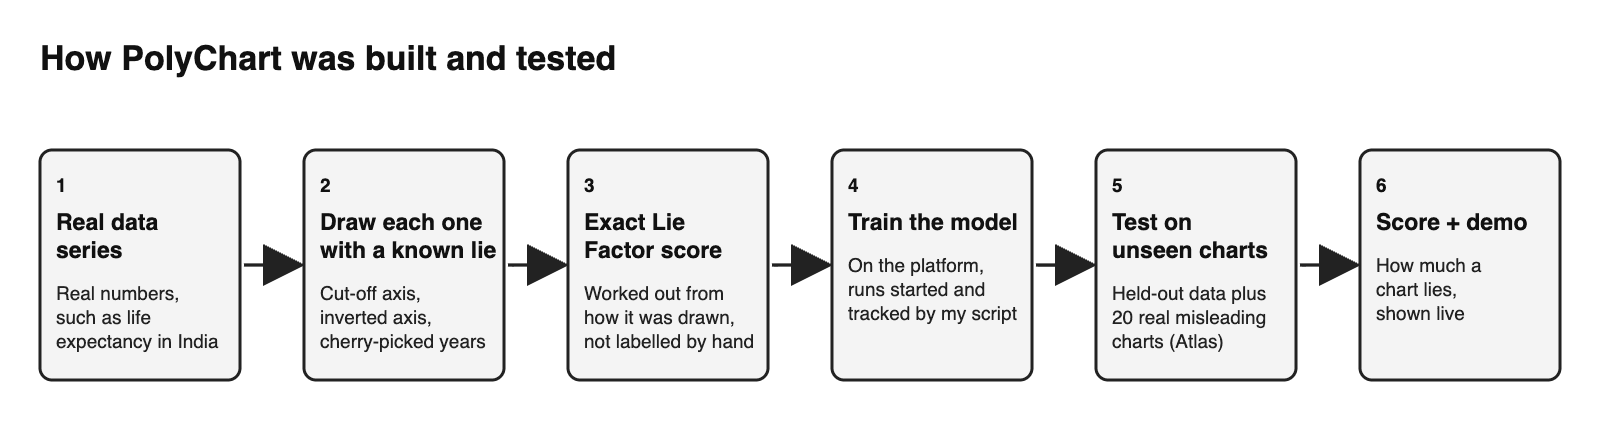
To teach the model, I drew charts from real data series on purpose, with a known distortion in each: a cut-off axis, an inverted axis, a cherry-picked window of years. Because I picked the distortion, I knew its exact score without anyone labelling it by hand.
I also collected a small set I called the Deception Atlas: 20 real, published, misleading charts, each checked against the sources recorded with it. It gives the model a test made of charts it never trained on.
Then I trained the model on the platform. The platform's web app was the only way in at first, so in July I watched its network traffic and wrote a small program that launched and tracked the training runs by itself, before the official API existed. It's public. That let me run a lot of experiments instead of clicking buttons.
I entered the same model in all seven categories, with a different dataset and demo for each. My best score on the platform's held-out test for Data & Visualization was 85.9.
There's a live demo where you can draw the same data honestly and dishonestly and watch the score move.
Research
Primary research. I collected the 20 real misleading charts myself and checked each against the sources recorded with it. I also probed the platform directly: I watched what its web app sent over the network and wrote a program to drive it, then read the saved record of every training job. I didn't interview or test with any users.
Secondary research. The score is Edward Tufte's Lie Factor, from his work on how charts mislead. I read Adaption's official API docs, which went live on 28 July 2026, and tested the platform's own claim that crossing 20,000 data points adds about 16 points. It reproduced at +17.4. I didn't study other entries.
How I tested it
The main test was a paired one. I trained the same dataset with and without 2,000 extra synthetic rows, on the same random seed, and scored both on held-out data the model never saw. The extra rows helped on 10 of 10 pairs. The average gain was 13.4 points, with a 95 percent range of 11.7 to 15.1. The odds of that happening by luck are about 1 in 500.
Controls mattered. Three runs with no extra rows scored 52.1, 63.8 and 60.7 on the held-out test, so one run can't be trusted. Identical runs differ by about 2.75 points, and reporting only the best of several runs adds another 2.1 to 6.3. The Atlas is a second held-out test, made of 20 real charts.
For the next experiment, training a model to give a continuous severity score, I fixed the analysis plan before any run.
What I didn't measure: I never tested it with real readers, and 20 real charts is a small set.
What happened
I won first place in the Data & Visualization category, and the $4,000 prize. Adaption announced it on 18 August 2026. Their line on the entry: a model "designed to determine whether claims made from charts are actually supported by the underlying data and to detect misleading visual patterns."
Afterwards I became an Adaption ambassador. It's unpaid. It gives me platform access and credits, which pay for the next experiments.
What I learned
The number on the screen isn't the number that matters. The platform showed a win rate measured on the same kind of data it trained on. The honest score came from a separate held-out test. In one matched pair, the better model looked 6.2 points worse on the displayed number. If I had chased the displayed one, I would have picked the weaker model.
Pick the part of the brief where you have something nobody else has. Every entrant could run the platform. Few could bring a dataset like the Atlas. I wrote two research papers alongside it, and I stayed visible on the challenge's Discord, X and LinkedIn the whole time.
I also got things wrong. When I recomputed every statistic from the saved run records in October, I had to correct nine statements in my August preprint. Check your numbers twice, then once more after you've published them.
One practical scar: uploading the model files from my network died halfway, silently, again and again, and it cost me about 14 hours. The progress bar kept moving while no data did. Forcing the connection onto IPv4 fixed it.
Links
- Write-up, datasets and weights: carsonrodrigues.com/adaption-autoscientist
- Live demo: lie-factor.carsonrodrigues.com
- Platform client (public): github.com/rodriguescarson/adaption-autoscientist-api
- Model weights: Hugging Face
Available · London / UK · senior AI, AI FDE, contract
Building something with AI?
Voice agents, MCP servers, LLM pipelines, agentic workflows — pick a slot, drop a message, or send your email and I'll reply within a day.
Replies within ~24 hours · London, UK · on-site, hybrid or remote